
Fibotin 제작자: Tapio Salo
visualize the fibonacci retracement levels
사용자 2명사용자 2명
확장 메타 데이터
스크린샷
정보
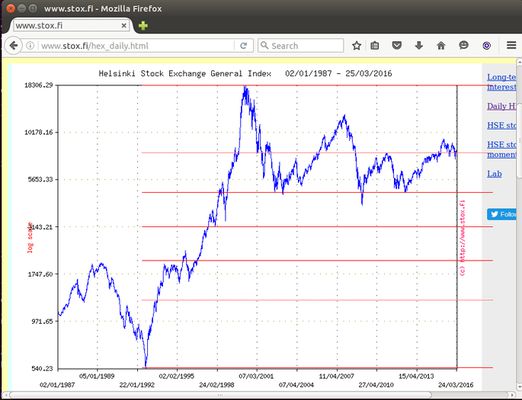
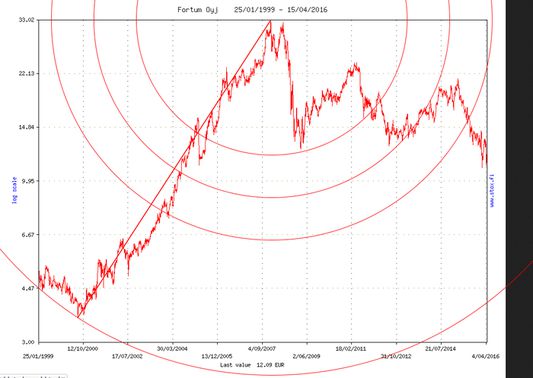
Fibotin is a plotting tool for illustrating the fibonacci retracement level graphically from the stock chart images found from pages related to stock markets. With this tool user can set fibonacci retracement levels on the image in the web page and quickly see if the the price action is close to any desired retracement levels.
For background information see articles about technical analysis for stock markets.
http://stockcharts.com/school/doku.php?id=chart_school:chart_analysis:fibonacci_retracemen
For background information see articles about technical analysis for stock markets.
http://stockcharts.com/school/doku.php?id=chart_school:chart_analysis:fibonacci_retracemen
리뷰어 1명이 2점으로 평가함
추가 정보
- 부가 기능 링크
- 버전
- 3.1resigned1
- 크기
- 16.21 KB
- 최근 업데이트
- 2년 전 (2024년 4월 25일)
- 라이선스
- MIT 라이선스
- 버전 목록
- 모음집에 추가